
by Striped Giraffe Team
8. November 2019
Reading time: 5 Minutes
Creating Test Data With Machine Learning
When it comes to Data Science algorithm design, real production data is always a must. However, one can imagine software engineering and development scenarios requiring data that only resembles the real one, while being artificially generated.
So why would you use fake data?
For a variety of reasons. One example may be the development of a financial Business Intelligence dashboard by a third party not supposed to see the actual sales figures. Another scenario could be making a predictive model prototype operational at scale by a Data Engineering team not eligible to have access to the actual input data.
Generative machine learning
Machine learning has been traditionally divided into supervised and unsupervised branches. However, modern machine learning use cases often go beyond this basic classification. Generative machine learning is about generating datapoints rather than labeling or grouping them. In one of the projects carried out for Ratioform, we used generative machine learning to simulate invoice data in order to test the scalability of our other machine learning algorithms as well as to estimate the noise level of their output.
Problem break-down
We simulated invoice data as money spent by customers on products in a predefined time window. This constitutes a simple dataset of three variables — Customer ID, Product ID and Sales Amount. This is the PRODUCT-CUSTOMER matrix, an extremely useful basic structure for e-commerce advanced analytics:

Figure 1 — Product-Customer sales matrix.
Raw IDs have no predictive value. For this reason they are replaced with normalized ranks:
- Normalized Customer Rank (NCR) is the rank of a customer after sorting by customer revenue.
- Normalized Product Rank (NPR) is the rank of a product after sorting by product revenue.

Figure 2 — Product-Customer sales matrix: IDs are replaced with normalized ranks. In addition, both Products and Customers are sorted by their ranks.
Our generative machine learning task is about simulating datapoints in a 3-dimensional space of NCR, NPR and Sales Amount. In a naïve approach, we would fit a predictive model to all combinations of NCR and NPR under certain granularity in order to predict the Sales Amount. This is unrealistic for a number of reasons. First of all, real PRODUCT-CUSTOMER matrices are extremely sparse. In our real-world situation, i.e. at Ratioform, only 0,04% of matrix entries had values greater than zero. Secondly, two input variables don’t hold enough information to reliably model the distinction between zero and non-zero when running regression. Lastly, a model trained this way would be either huge and overfitted or wouldn’t provide the necessary output granularity.
A general solution to these types of challenges is multivariate probability density estimation. In a nutshell, the whole space is divided into areas with different probabilities for datapoints to appear. Each new datapoint is then placed in an area of this space based on a set of generated random numbers. There are multiple probability density estimation techniques available. Generally speaking, the more dimensions there are, the more complicated and computationally intensive they become.
In our generative approach, we break-down the whole problem into two following models:
- a 2-D probability density model that generates non-zero NCR-NPR combinations based on real data, and
- a predictive model based on real data that sets sales values to the generated datapoints.
Example of our 2-D density we used in the project for Ratioform is shown in Figure 3. The more violet the color is, the bigger the chance of a datapoint for a given NCR-NPR pair appearing. An arbitrary number of datapoints can be created this way. In a second step, a regression Random Forest is trained on the real data, treating NCR and NPR as input variables and Sales Amount as the target variable. Only records with values of the target variable which are greater than zero are considered.
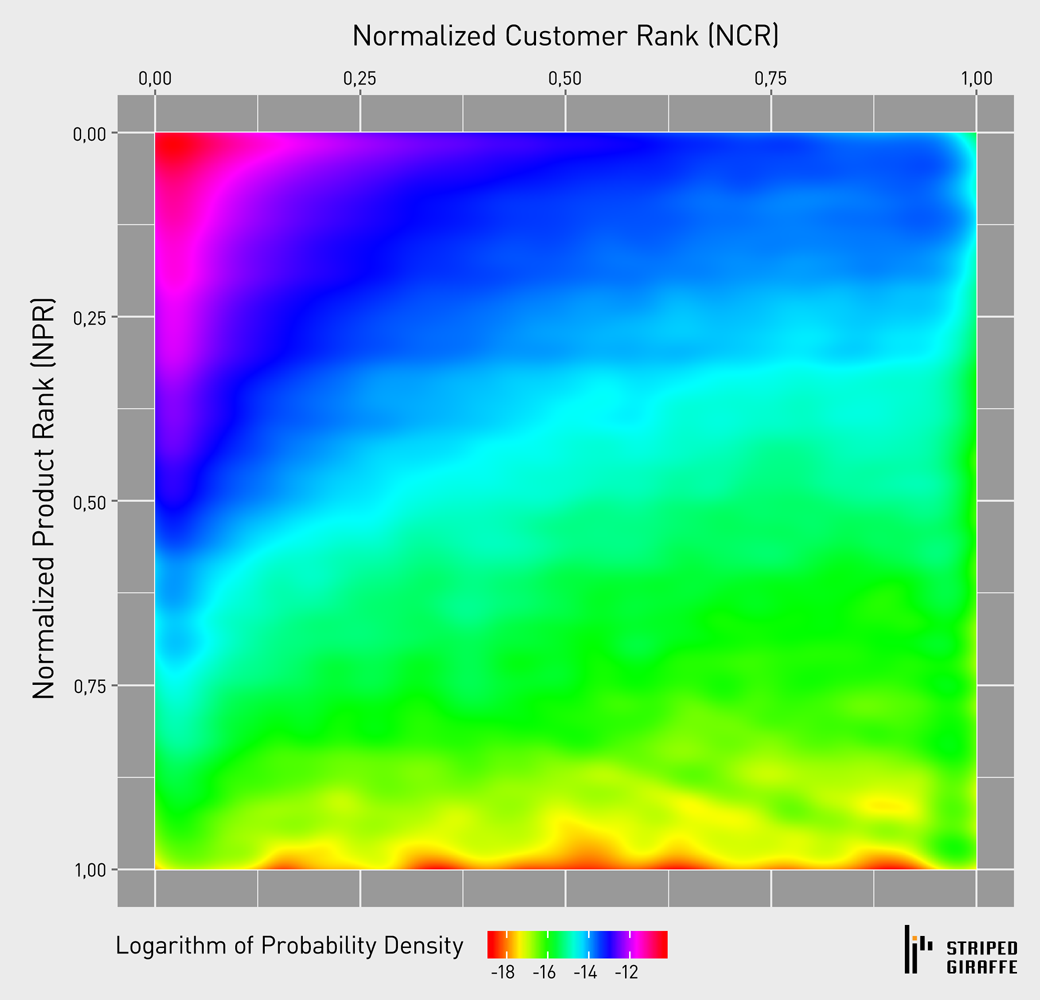
Figure 3 — Bivariate probability density used to generate datapoints.
This way, the predictive model only needs to fit positive sales values allowing for better accuracy.
In the final step, the Random Forest regressor is applied to the fake datapoints, thus obtaining the fake dataset.
Because of fixed output values in leaves of Random Forest, generated fake data has less distinct values than the real data. This can be corrected by capturing the distribution of differences between real and predicted values and using it to noise up the model output.
Results on real data
Figure 4 shows the results of running mentioned algorithm on a real PRODUCT-CUSTOMER matrix. For readability, only a sample of all of the generated datapoints is displayed.
- Displayed sales values are the logarithm of actual sales divided by mean sales.
- ORIGINAL SALES is the original sales data.
- MODELED SALES shows the results of fitting trained regressor to real data.
- GENERATED SALES POINTS shows raw generated datapoints.
- Finally, GENERATED SALES VALUES show the results of fitting the regression model to datapoints generated.
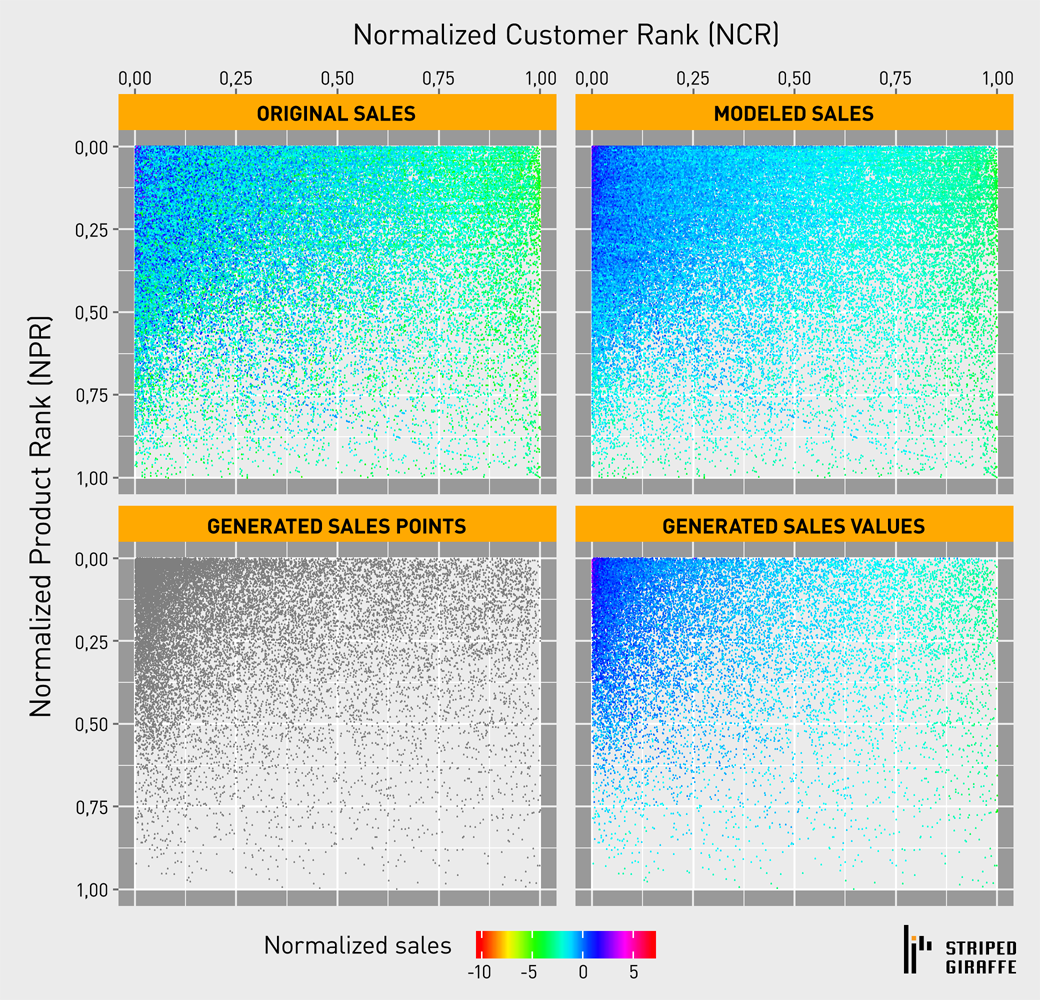
Figure 4 — Results on real data.
Summary
Generated fake data can be used for development purposes and handled less carefully than the original real data. It can also be scaled up or down in terms of volume to empirically simulate scalability of dependent data pipelines. Of course, it cannot be used for Data Science as it is missing interactions between pairs of customers and pairs of products – they are broken and not regenerated.
On a more general level, a similar approach could be taken to simulate other data entities. Unfortunately, each case might be different and the simulation would get more difficult with each new constraint such as new variable, values for the new variable, relationships between the tables, etc. More conservative approaches such as data masking might be the preferred option for more complex scenarios.