
Understand data. Identify trends. Make better decisions.
Business Intelligence provides transparency into business processes, performance, and trends. Advanced Analytics takes it a step further by using statistical methods, forecasting models, and AI to identify patterns, assess future trends, and provide targeted support for decision-making.
We develop analytics solutions that integrate business requirements, data, technology, and user experience – from strategy and architecture to dashboards and data models, all the way to forecasts and production-ready analytics applications.
Challenge
When Data Is Available, but Reliable Insights Are Missing
Many companies have numerous reports, dashboards, and analytics tools. Yet it remains difficult to interpret key metrics consistently, understand root causes, or respond to changes in a timely manner.
Typical challenges include: We create a robust foundation so that information is not only available but also understandable, trustworthy, and actionable.
- Contradictory metrics and definitions,
- manually generated reports and lengthy approval processes,
- isolated data across different systems,
- outdated data or a lack of depth of detail,
- confusing dashboards without clear actionable insights,
- lack of forecasts and early warning indicators,
- low user acceptance,
- BI landscapes that have evolved over time and require significant maintenance.
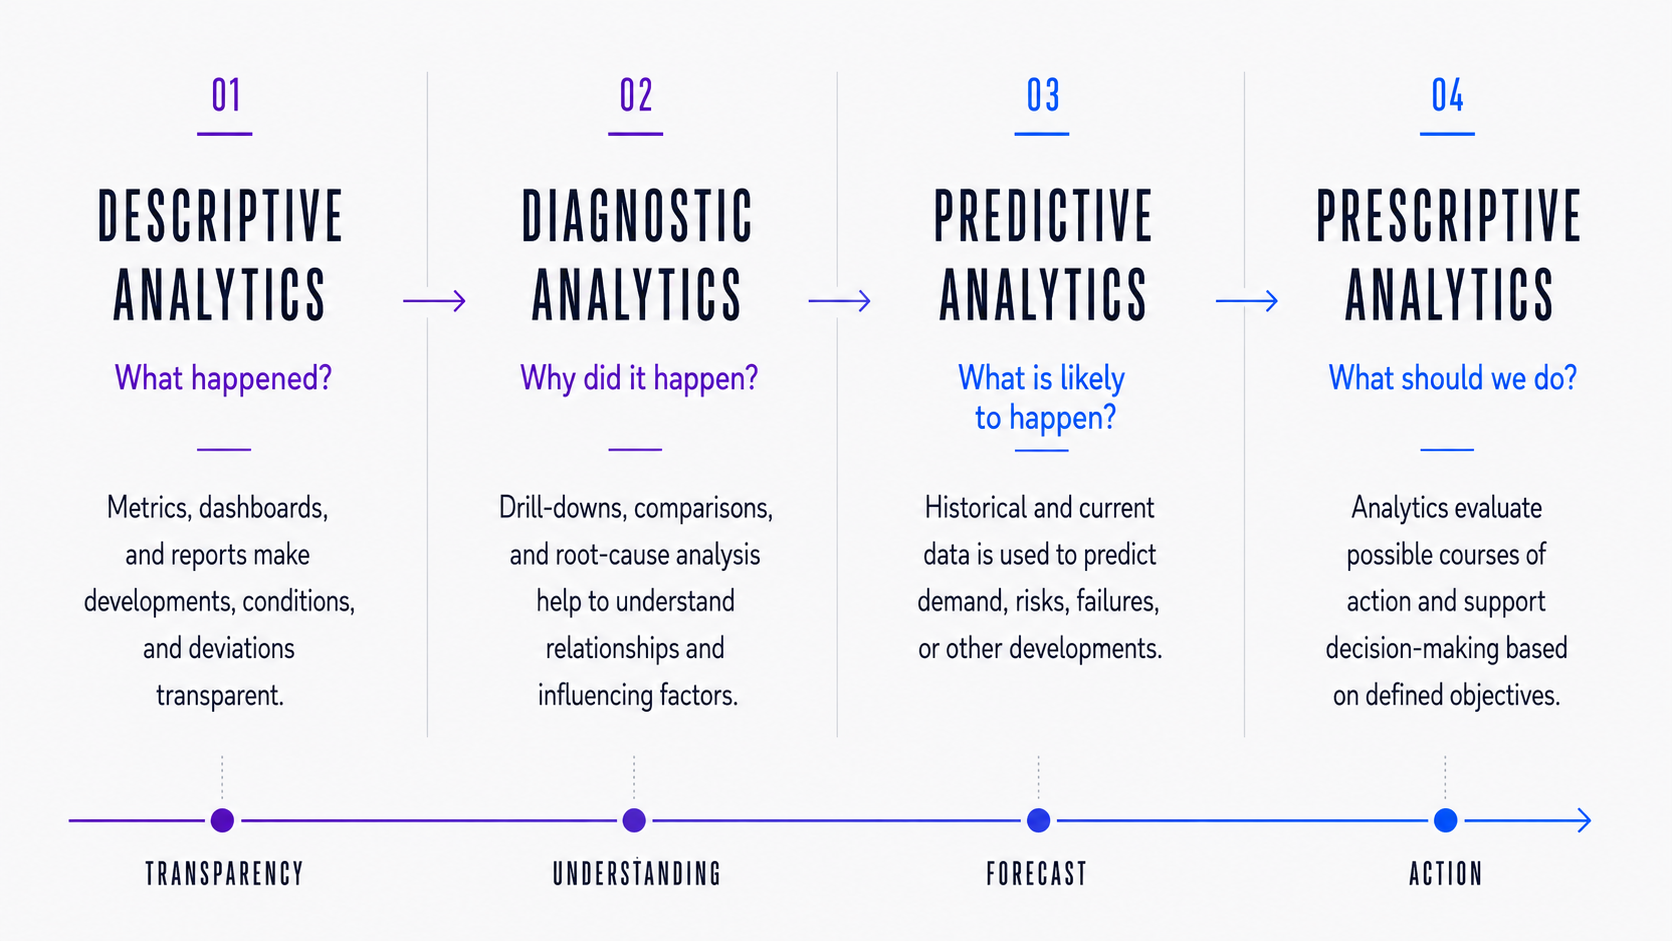
Spectrum of
Analytics
From Retrospective Analysis to Action Recommendations
Key Services
What BI & Advanced Analytics Encompass
Reporting and Dashboards
We develop clear reports and role-based dashboards that provide relevant information at the required level of detail.
Self-Service Analytics
Business users are granted controlled access to data and can perform analyses independently without having to rely on IT for every query.
Semantic Models and Metrics
Consistent definitions, business logic, and semantic layers ensure that metrics are interpreted consistently across reports and departments.
Operational and Real-Time Analytics
Up-to-date data is directly integrated into operational processes, enabling companies to respond more quickly to events and changes.
Predictive and Prescriptive Analytics
Forecasts, scenarios, and optimization models support planning and decision-making.
Embedded Analytics
Analytics functions are directly integrated into portals, line-of-business applications, and digital services, making them available right where decisions are made.
AI-Assisted Analytics
AI supports the retrieval, interpretation, and preparation of data – for example, through natural-language queries, automatic summaries, and the detection of relevant anomalies.
Use Cases
Apply analytics where decisions are made
- Sales, revenue, and margin analyses
- Demand and sales forecasts
- Customer, segment, and churn analyses
- Product and portfolio management
- Inventory and capacity planning
- Supply chain and logistics analyses
- Financial, risk, and compliance reporting
- Production and quality analyses
- Predictive maintenance
- Fraud and anomaly detection
- Marketing and campaign analyses
- Management and executive dashboards
Data Base
Reliable analyses begin before the dashboard
Even the best visualization tool cannot permanently compensate for inconsistent definitions, unsuitable data models, or quality issues.
That is why, in BI and analytics projects, we also consider:
- Data sources and data integration,
- data warehouses, data lakes, and lakehouse platforms,
- data models and semantic layers,
- key metric definitions and business glossaries,
- data quality and data governance,
- role and permission models,
- performance, scalability, and costs.
This ensures that we don’t end up with an isolated reporting solution, but rather a robust analytics architecture.
User Orientation
Insights must be clear and actionable
Analytics only creates value when users can quickly grasp information, interpret it correctly, and translate it into decisions.
That’s why we design dashboards and analytics applications tailored to specific roles and usage scenarios.
In doing so, we focus on:
- clear information hierarchies,
- relevant metrics rather than as many as possible,
- easy-to-understand visualizations,
- useful drill-downs and filters,
- consistent terminology and interactions,
- responsive and accessible design,
- integration into existing workflows.
Our Approach
From the Initial Question to a Productive Analytics Solution
1. Understand Objectives and Decision-Making Needs
We analyze business objectives, processes, user groups, and the decisions that need better support in the future.
2. Evaluate Data and Architecture
We review data sources, data quality, models, existing BI solutions, and technical constraints.
3. Design the Solution and Key Metrics
Together, we define KPIs, semantic models, analytical functions, visualizations, and the appropriate target architecture.
4. Iterative Development and Validation
We implement prioritized use cases step by step and test them early on with future users.
5. Integration and Operation
We integrate the solution into the existing system landscape and establish governance, monitoring, enablement, and continuous improvement.
Business
value
Data Leads to Better Decisions
Greater Transparency
Standardized metrics and up-to-date analyses create a shared view of performance and development.
Faster Decisions
Relevant information is available exactly where it’s needed.
Less Manual Effort
Automated data flows and reports reduce repetitive data preparation and reconciliation.
Earlier Responses
Forecasts and anomaly detection highlight opportunities and risks sooner.
Better Planning
Scenarios and forecasts improve the management of resources, inventory, capacity, and investments.
Greater Acceptance
User-centric solutions facilitate access to data and promote data-driven collaboration.
Scalable Analytics
Standardized models and platforms enable the faster implementation of additional use cases.
Let’s talk
Do you need a specific offer or a sparring partner to discuss ideas?
Just contact us:
- experts@striped-giraffe.com
- +49 (0)89-416 126-667
We will be happy to support you.
WE CREATE ADDED VALUE FOR OUR CUSTOMERS.
This leads to a long-term cooperation with our customers, which we appreciate very much. You can find even more e-books, case studies, and co. in our Insights.