by Striped Giraffe Team
23. May 2019
Reading time: 14 Minutes
Looking for Similarities With Association Rule Mining
We like having our ten stripes in a row and we ask ourselves who else does?
Life is unfair! Some geniuses are acknowledged and honored during their lifetime, some even long after it, but there are a lot of fundamental research pioneers who have unfortunately fallen into obscurity in society’s collective memory. Petr Hájek (6 Feb. 1940 – 26 Dec. 2016), Professor and Director of Research at the Institute of Mathematics of the Czech Republic’s Academy of Science, was one of those pioneers who built the foundation of modern machine learning theory, and it is he to whom I devote this article.
More than 50 years ago, in 1966 – the year of the mini-skirt, Vietnam war protests and the space-race between United States and Soviet Union – Petr Hájek, together with his colleagues Tomáš Havránek, Ivan Havel and Metoděj Chytil, formulated the GUHA (General Unary Hypotheses Automation) principle. The GUHA principle describes the idea of using computers to generate series of hypotheses that describe relations between the properties of objects. Ultimately, the GUHA principle forms the foundation for Knowledge Discovery in Databases (KDD) (better known as data mining or knowledge extraction) and for unsupervised machine learning techniques, the research areas being emerged several decades later.
In this article, I would like to talk about association analysis, a simple but extremely useful unsupervised learning technique that traces back to Hájek’s GUHA principle. Generally speaking, association analysis addresses the problem of finding highly probable subsets of data and the highly probable subset combinations.
As we know, many businesses have enormous amounts of customer and customer purchasing data. For example, a grocery store definitely owns data containing the product names purchased in each transaction. Other retailers and the majority of online dealers also have similar data on purchases at their stores. Using these data, we might want to find subgroups of products that tend to co-occur, in either purchasing or in viewing behavior.
Retailers might be interested in cross-promoting product combinations with different deals, if they know that these products are very highly correlated in such a way that people purchase them together. Online platforms can use this information to generate content recommendations. Another huge topic is strategic product placement within grocery stores, because certain product arrangements encourage consumers to purchase them both at the same time. And of course, the variety of use cases goes far beyond the grocery store example! For instance Netflix-like applications recommending content based on viewing behavior, even without any feedback at all from the customer. Further embodiments of these ideas could lead to use cases covering the analysis of social trends and even the promotion of political campaigns.
Let’s look at the simplest version of association analysis based on grocery basket analysis – the canonical way of thinking about finding associations among data. We’re assuming that six people have a basket at a grocery store, and they have different objects in their basket at checkout time. Imagine now that we have millions of these checkout transactions and they’re across thousands of products; we now might want to use this type of data to analyze patterns of co-occurrence!
Which products tend to appear in baskets at what rate, and what are the association rules? And knowing those association rules, given that they’ve got one object in their basket, we’re going to predict that they are more likely to have a second object in their basket.
For example, consider the following “grocery baskets” of six customers:
| Basket ID | Items |
| 1 | Cola, Butter, Bread, Cheese |
| 2 | Bread, Cheese, Milk |
| 3 | Bread, Fanta, Beer, Eggs, Butter |
| 4 | Eggs, Salami, Butter, Beer, Cola, Toast |
| 5 | Toast, Eggs, Butter, Fanta |
| 6 | Bread, Milk, Butter, Fanta, Cheese |
Based on these data, we want to analyze patterns of co-occurrence:
𝐵𝑟𝑒𝑎𝑑⟶𝐵𝑢𝑡𝑡𝑒𝑟
Let’s look at this problem from a more abstract perspective.
First, imagine that we have 𝑖 different objects, for example, there could be 𝑖 different items for sale in a grocery store, and each of these items has a unique index from one to 𝐼
𝑖∈{1,…,𝐼}
Then let us assume we have a collection of subsets of these items, i.e. 𝐷𝑛 for the 𝑛𝑡ℎ subset would be a subset of items from one to 𝐼. In other words, we should think of 𝐷𝑛 as giving the list of things purchased by customer 𝑛=1,…,𝑁
𝐷𝑛=⊂{1,…,𝐼}
So now there are two objectives we want to accomplish here. The first is to perform an association analysis. This is simply about locating subsets of products that have a high probability of occurring together. For instance, let’s agree on
𝐾, being 𝑏𝑟𝑒𝑎𝑑, 𝑚𝑖𝑙𝑘 and 𝑒𝑔𝑔𝑠
and then we’ll count how many of the grocery baskets contain those three products together. By dividing this figure by the total number of baskets, we get the fraction of customers that purchased bread, milk and eggs together:
𝑃(𝐾)=#{𝑛 𝑠𝑢𝑐ℎ 𝑡ℎ𝑎𝑡 𝐾⊆𝐷𝑛}𝑁
So, our goal is to find these subsets 𝐾, where 𝑃(𝐾) is a large number.
Another objective is to discover association rules. This is the problem of finding objects that are highly correlated. Let 𝐴 and 𝐵 be two disjoint subsets 𝐴∩𝐵=∅ of the products {1…𝐼}. Then 𝐴⟹𝐵 can be interpreted in a way that purchasing 𝐴 increases the likelihood of purchasing 𝐵 as well.
In order to learn all those figures, we need to represent our basket in a different way:
| Basket ID | Beer | Bread | Butter | Cheese | Cola | Eggs | Boys | Milk | Salami | Toast |
| 1 | 0 | 1 | 1 | 1 | 1 | 0 | 0 | 0 | 0 | 0 |
| 2 | 0 | 1 | 0 | 1 | 0 | 0 | 0 | 1 | 0 | 0 |
| 3 | 1 | 1 | 1 | 0 | 0 | 1 | 1 | 0 | 0 | 0 |
| 4 | 1 | 0 | 1 | 0 | 1 | 1 | 0 | 0 | 1 | 1 |
| 5 | 0 | 0 | 1 | 0 | 0 | 1 | 1 | 0 | 0 | 1 |
| 6 | 0 | 1 | 1 | 1 | 0 | 0 | 1 | 1 | 0 | 0 |
Following our first objective, we’re looking for a subset of those 10 items that co-occur with high probability. This probability could be defined by some threshold, let’s say 49%. In this simple case, we could easily discover that eggs and butter appear in 50% of all baskets, which is beyond the threshold and therefore we’re stating that these two items co-occur with high probability in this dataset.
Unfortunately, or luckily 😉, real-life situations are much more sophisticated. There is a good probability that we have more than 6 customers and way more items for sale. So how about having 𝑁≈108 and 𝐼≈104?
Using straightforward combinatorics would lead us to the conclusion that a simple brute-force search approach is not going to be possible in this case.
The first question we could ask ourselves is how many product subsets 𝐾⊆{1,…,𝐼} are there at all? Each subset can be represented by a binary indicator vector of length 𝐼 and the total number of possible vectors is 2𝐼.
And what if we didn’t check all those possible product combinations, as only very few people (and I think I know them all personally 😊) will have a basket with all of the grocery store items in it? How about if we only check up to 𝑏 items? Hmm, the number of sets of size 𝑏 picked from 𝐼 items is
(𝐼𝑏)=𝐼!𝑏!(𝐼–𝑏)!
which might become a lifetime job with a lot of follow-up tasks for your descendants. If we had only 𝐼=104 and 𝑏=5 the total number of possible product combinations would be
(1045)=1018
As you can imagine, the solution to this tricky problem needs an algorithm that reduces the calculation effort and somehow reduces the count of subsets 𝐾⊆{1,…,𝐼} that need to be taken into consideration.
But first, let us decide which terms need to be calculated. As already mentioned, we’re still looking at all relevant product subsets 𝐾⊆{1,…,𝐼}. And of course, we’re still bearing in mind those disjoint product subsets 𝐴 and 𝐵 so that 𝐴,𝐵⊂𝐾, 𝐴∪𝐵=𝐾, 𝐴∩𝐵=∅.
So the first term of an interest is the probability of 𝐾, which can also be written as the joint probability of subsets 𝐴 and 𝐵.
𝑃(𝐾)=𝑃(𝐴,𝐵)
We call this term the prevalence or support of the items in 𝐾. In essence, we’re looking for all subsets of 𝐾 such that their combination in 𝐾 co-occurs often.
E.g. if 𝐾={𝐸𝑔𝑔𝑠,𝐵𝑢𝑡𝑡𝑒𝑟,𝑀𝑖𝑙𝑘}, 𝐴={𝐸𝑔𝑔𝑠}, 𝐵={𝐵𝑢𝑡𝑡𝑒𝑟,𝑀𝑖𝑙𝑘} and 𝑃(𝐾)=0,2 then eggs, butter and milk will be purchased together in 20% of all cases (baskets).
And then we’d like to learn the conditional probability of set 𝐵 given set 𝐴. In other words, if you know that 𝐴 is in the grocery basket, what is the probability that 𝐵 will also appear in the basket. We call it confidence, which will be used as the basis for assumption 𝐴⟹𝐵 (purchasing 𝐴 increases the likelihood of also purchasing 𝐵).
𝑃(𝐵|𝐴)=𝑃(𝐴,𝐵)𝑃(𝐴)=𝑃(𝐾)𝑃(𝐴)
e.g. if 𝐾={𝐸𝑔𝑔𝑠,𝐵𝑢𝑡𝑡𝑒𝑟,𝑀𝑖𝑙𝑘}, 𝐴={𝐸𝑔𝑔𝑠}, 𝐵={𝐵𝑢𝑡𝑡𝑒𝑟,𝑀𝑖𝑙𝑘} and 𝑃(𝐵|𝐴)=0,65 then eggs were purchased in 65% of all checkouts where butter and milk were also purchased.
Finally, we want to know how much more certain we are of getting 𝐵 in the basket if 𝐴 is already there, and that compared to the simple prevalence of 𝐵.
𝐿(𝐴|𝐵)=𝑃(𝐴,𝐵)𝑃(𝐴)𝑃(𝐵)=𝑃(𝐾)𝑃(𝐴)𝑃(𝐴)𝑃(𝐵)=𝑃(𝐾)𝑃(𝐵)
This is called the lift of rule 𝐴⟹𝐵 (purchasing 𝐴 increases the likelihood of also purchasing 𝐵).
E.g. if 𝐾={𝐸𝑔𝑔𝑠,𝐵𝑢𝑡𝑡𝑒𝑟,𝑀𝑖𝑙𝑘}, 𝐴={𝐸𝑔𝑔𝑠}, 𝐵={𝐵𝑢𝑡𝑡𝑒𝑟,𝑀𝑖𝑙𝑘} and 𝐿(𝐴|𝐵)=1,6 then it is 1,6 times more likely that butter and milk will be purchased given that eggs are in the grocery basket.
Again, remember that we agreed on setting a threshold 𝜏 and that the empirical probability of 𝐾 needs to exceed this threshold. The GUHA principle based on the Apriori algorithm provides us with the solution to find all subsets 𝐾 without having to search in all 2𝐼 product combinations.
First, we need to set 0<𝜏<1 such that only a relatively small fraction of all subsets 𝐾 satisfies 𝑃(𝐾)>𝜏. The Apriori algorithm restricts the number of subsets 𝐾 that need to be checked by comparing their probabilities with the above-mentioned threshold. And of course, if 𝐾 satisfies 𝑃(𝐾)>𝜏 it appears in 𝑁⋅𝜏 of 𝑁 baskets.
Before we come to the definition of the Apriori algorithm, let me remind you of some basic probability rules that form its foundation:
If 𝐾′=𝐾∪𝐴 and 𝐾⊂{1,…,𝐼}, 𝐴⊂{1,…,𝐼}
then 𝑃(𝐾)<𝜏⟹𝑃(𝐾′)<𝜏
because 𝑃(𝐾′)=𝑃(𝐾,𝐴)=𝑃(𝐴|𝐾)𝑃(𝐾)≤𝑃(𝐾)<𝜏
And conversely, if 𝑃(𝐾)>𝜏 and 𝐴⊂𝐾 then 𝑃(𝐴)>𝑃(𝐾)>𝜏
The problem can be represented as a lattice diagram:
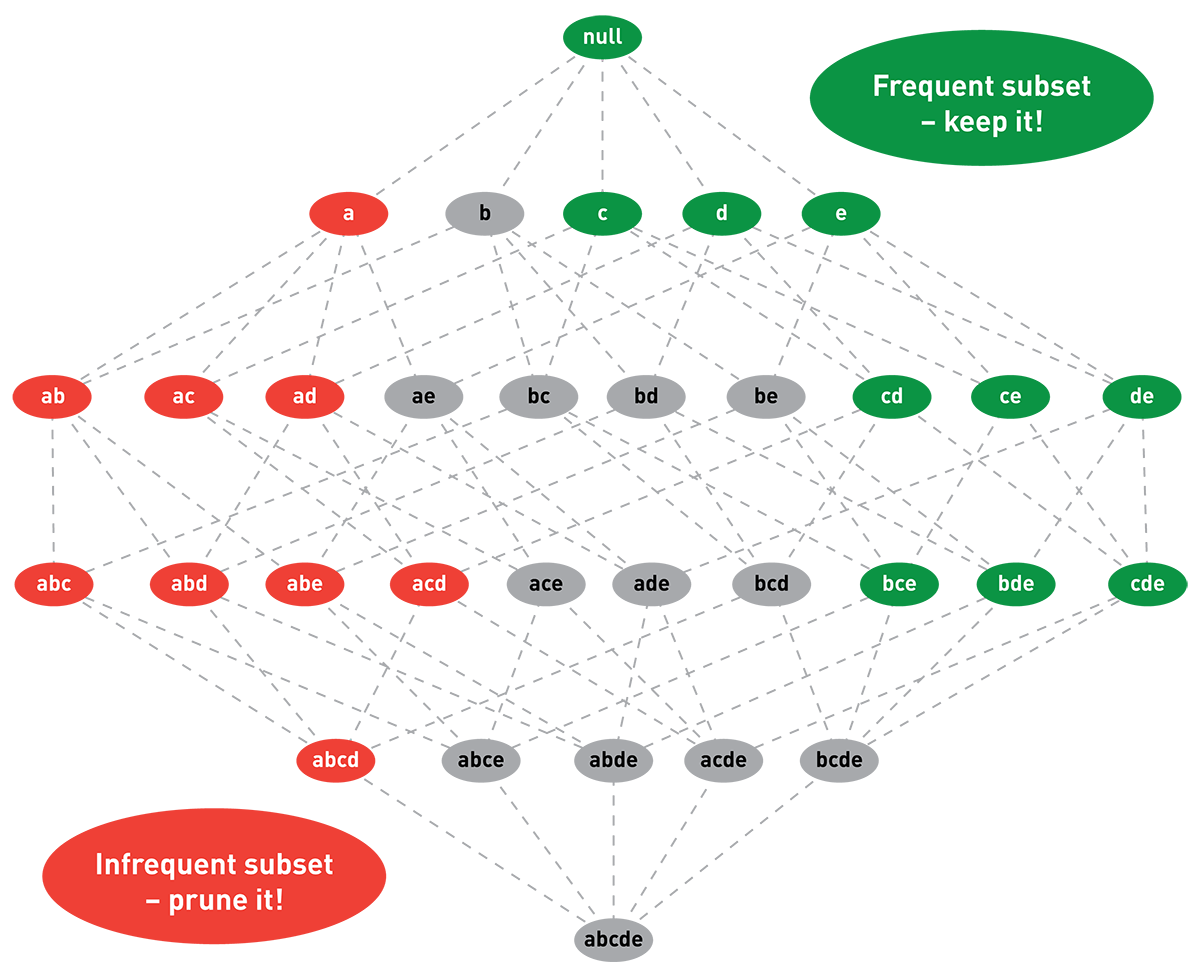
And here is the simplified version of the Apriori algorithm:
- Set threshold 𝑁⋅𝜏 where 0<𝜏<1 but needs to be reasonably small
- |𝐾|=1 for each item. 𝑃(𝐾)≥𝜏 i.e. it needs to be in ≥𝑁⋅𝜏 baskets. Those with 𝑃(𝐾)<𝜏 need to be dropped
- |𝐾|=2 for all 𝐾 that survived the previous step recheck 𝑃(𝐾)≥𝜏. Those with 𝑃(𝐾)<𝜏 need to be dropped
- …
- |𝐾|=𝛾 for all 𝐾 that survived the previous step recheck 𝑃(𝐾)≥𝜏. Those with 𝑃(𝐾)<𝜏 need to be dropped and the rest needs to be kept!
As 𝛾 increases, the number of sets that survive will decrease! At a certain 𝛾, no sets will survive, and we’re done!
Coming back to the above-mentioned association rules – confidence, support and lift – we’ll immediately recognize that having all 𝐾 such that 𝑃(𝐾)≥𝜏 where 𝐴 and 𝐵 are partitions of 𝐾, both 𝑃(𝐴) and 𝑃(𝐵) are already there, which means 𝑃(𝐵|𝐴) and 𝐿(𝐴|𝐵) can be easily calculated without any additional effort.
There are a lot of brilliant implementations of the Apriori algorithm and association rules. In the following coding example, we’d like to provide you with a Python-native implementation of the Apriori algorithm, which is based on a successive reduction of the initial dataset. For association rules we use the MLxtend framework. For this example we use a subset of data from the Insta-Cart Market Basket Analysis dataset on Kaggle. We will be using purchase order data specifying which products were purchased in which order.
order_products train.csv contains extracted previous order contents for all customers:
| order_id, | product_id, | add_to_cart_order, | reordered |
| 1, | 49302, | 1, | 1 |
| 1, | 11109, | 2, | 1 |
| 1, | 10246, | 3, | 0 |
| … |
The initial dataset contains 131 209 unique orders.
There are two questions we are going to answer in this example:
What are the sets of the three items found together more than 393 times in the above dataset?
What are the association rules between the articles within those subsets?
Code section:
And the console output looks as follows:
Overall count of unique orders  131209
    order_id    product_id    add_to_cart_order    reordered
0          1         49302                    1            1
1          1         11109                    2            1
2          1         10246                    3            0
3          1         49683                    4            0
4          1         43633                    5            1

run  1 count of elements  589
run  2 count of elements  406
run  3 count of elements  18

['Bag of Organic Bananas', 'Organic Strawberries', 'Organic Hass Avocado']     occured in 710 baskets
['Bag of Organic Bananas', 'Organic Strawberries', 'Organic Raspberries']      occured in 649 baskets
['Bag of Organic Bananas', 'Organic Strawberries', 'Organic Baby Spinach']     occured in 587 baskets
['Bag of Organic Bananas', 'Organic Raspberries', 'Organic Hass Avocado']      occured in 531 baskets
['Bag of Organic Bananas', 'Organic Baby Spinach', 'Organic Hass Avocado']     occured in 497 baskets
['Organic Baby Spinach', 'Banana', 'Organic Avocado']                          occured in 484 baskets
['Banana', 'Large Lemon', 'Organic Avocado']                                   occured in 477 baskets
['Banana', 'Limes', 'Large Lemon']                                             occured in 452 baskets
['Bag of Organic Bananas', 'Organic Strawberries', 'Organic Cucumber']         occured in 424 baskets
['Limes', 'Large Lemon', 'Organic Avocado']                                    occured in 389 baskets
['Organic Strawberries', 'Organic Raspberries', 'Organic Hass Avocado']        occured in 381 baskets
['Organic Strawberries', 'Banana', 'Organic Avocado']                          occured in 379 baskets
['Organic Strawberries', 'Organic Baby Spinach', 'Banana']                     occured in 376 baskets
['Bag of Organic Bananas', 'Organic Strawberries', 'Organic Blueberries']      occured in 374 baskets
['Organic Baby Spinach', 'Banana', 'Large Lemon']                              occured in 371 baskets
['Bag of Organic Bananas', 'Organic Cucumber', 'Organic Hass Avocado']         occured in 366 baskets
['Organic Lemon', 'Bag of Organic Bananas', 'Organic Hass Avocado']            occured in 353 baskets
['Banana', 'Limes', 'Organic Avocado']                                         occured in 352 baskets

                                     antecedents                                      consequents

0  (Bag of Organic Bananas, Organic Hass Avocado)                          (Organic Strawberries)
1  (Bag of Organic Bananas, Organic Strawberries)                          (Organic Hass Avocado)
2    (Organic Hass Avocado, Organic Strawberries)                        (Bag of Organic Bananas)
3                        (Bag of Organic Bananas)    (Organic Hass Avocado, Organic Strawberries)
4                          (Organic Hass Avocado)  (Bag of Organic Bananas, Organic Strawberries)
5                          (Organic Strawberries)  (Bag of Organic Bananas, Organic Hass Avocado)

Press any key to continue . . .
As you can see, these couple of lines of code could deliver us answers to the question regarding most frequent product subsets, as well as about association rules between groups of products frequently occurring together. I would encourage you to think about other interesting use cases where association analysis could provide you with incredible and profound insights.
——————-
Reference for GUHA method:
Mechanizing Hypothesis Formation. Mathematical Foundations for a General Theory; Petr Hájek, Tomáš Havránek, Springer-Verlag 1978 (ISBN 3-540-08738-9, 0-387-08738-9)